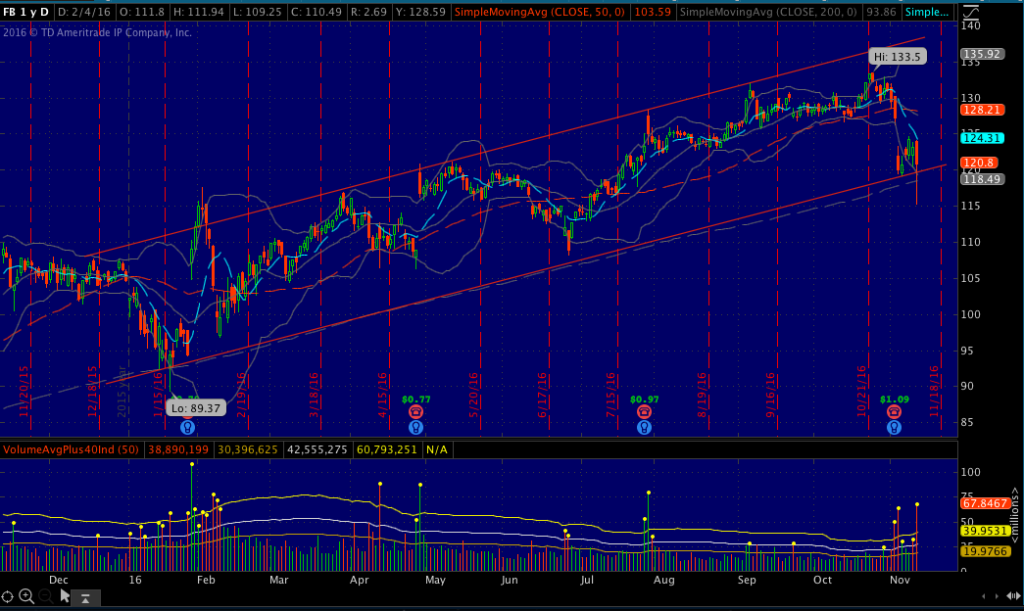
I haven’t been following the markets much lately but I’m trying to get back in sync with them by putting in some screen time after work. A neighbor of mine has a small portfolio and is holding Facebook so I started looking at it and his other holdings. I created the marked up screen shot you see below. It’s a 1-year daily chart, and I drew a trend line along the 3 most prominent lows. Two points make a line, and three points make a trend line. I duplicated the line and it fits nicely among many of the highs, making a channel. It tested the lower trend line today but buyers came in and brought it back up to close above the trend line. It will be interesting to see what it does in the next couple of days in this post-election time. Let’s see if it holds above the lower trend line and heads toward the upper one. I owned some of it late last year and made a nice profit on it but I usually trade on shorter time frames. Too bad because it would have obviously been a good longer-term investment this year. Wouldn’t you like to have sold it near the high before the sell-off — before the last earnings report?
FB from the close of 11/10/2016:
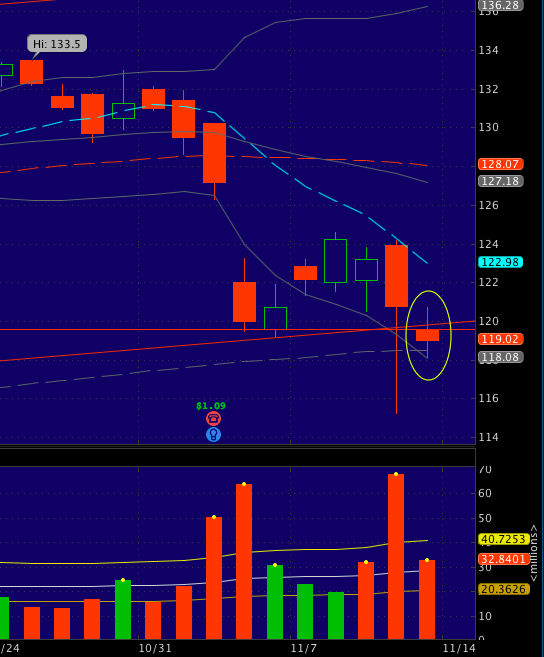
November 11, 2016: I drew in a new trend line at a support and resistance level. It closed below that level and below the lower vertical channel line. It had opened just under those trend lines, tested them (rose above), sold off, and then closed just a bit higher than the daily low. Let’s see what happens in the next few days. Will it continue to drop or push up above the trend lines again in the next few weeks? The volume was about 1.5 times normal at a glance.
And by the way, a mentor of mine said you should always draw your trend lines and pattern lines on a line chart (versus the candles shown here) for more accuracy. The points on a line chart will be the closing prices: an upper trend line will be across positive closes, and the bottom trend line will be across negative closes. I changed my chart to line mode and the lines could then be moved ever so slightly in this case. They say close only counts in horseshoes and hand grenades, but I think we could add stock charting to that list, too.
FB after the market close on November 11, 2016:
Disclaimer: Don’t make any trades based on anything you see here. I’m just “thinking aloud” and I’m not a financial advisor or certified anything. But with that said, don’t ever trade with your rent money or any other money that you can’t afford to lose. You can always learn with virtual or paper trading. Just be sure to act (as much as you can) like it’s real money on the line so it will feel real and you’ll behave the same way.